Our Services
Everybody wants to make better, more data-driven decisions. But it’s not always easy. Data can be messy, missing, and misleading.
No matter where you are on your journey, we can help. We’ve worked with businesses of all sizes and levels of digital sophistication. We’ll get you up and running with a measurement and reporting setup that requires minimal ongoing effort but delivers maximum ongoing insight. So you can get on with all that decision-making.
Analytics Setup
Starting from scratch? Let’s do it right. We’ll set you up with everything you need, and ensure your measurement, analytics, and reporting is customized to your business goals.
Audits & Enhancements
Got it all set up, but can’t shake the feeling that something, somewhere is wrong? Or perhaps you just want to take your measurement and analysis to the next level. We can help.

Reports & Visualizations
Dashboards don’t have to be the place where good data go to die. At Lucidate, we specialise in clear, beautiful reports that crystallise information and drive action.

Book a free consultation
Measurement Setup
New site, or just new to measurement? We’ll have you set up in no time.
Here’s our process:
Kickoff call: First we get to know you, your business, and your goals.
Measurement plan: Based on your goals, we’ll map out what needs to be measured and how.
Reporting plan: Once we know what you’re measuring, we’ll design your ideal reporting / visualisation framework.
Implementation and testing: We’ll setup up a testing environment and make sure we have everything working perfectly before we go live.
Rollout: Once everything’s ready, we’ll deploy to live and test again.
Handover / ongoing support: Depending on your needs, we can either give you a full, well-documented handover, or continue to provide ongoing support such as monthly reporting highlights.
Products we use:
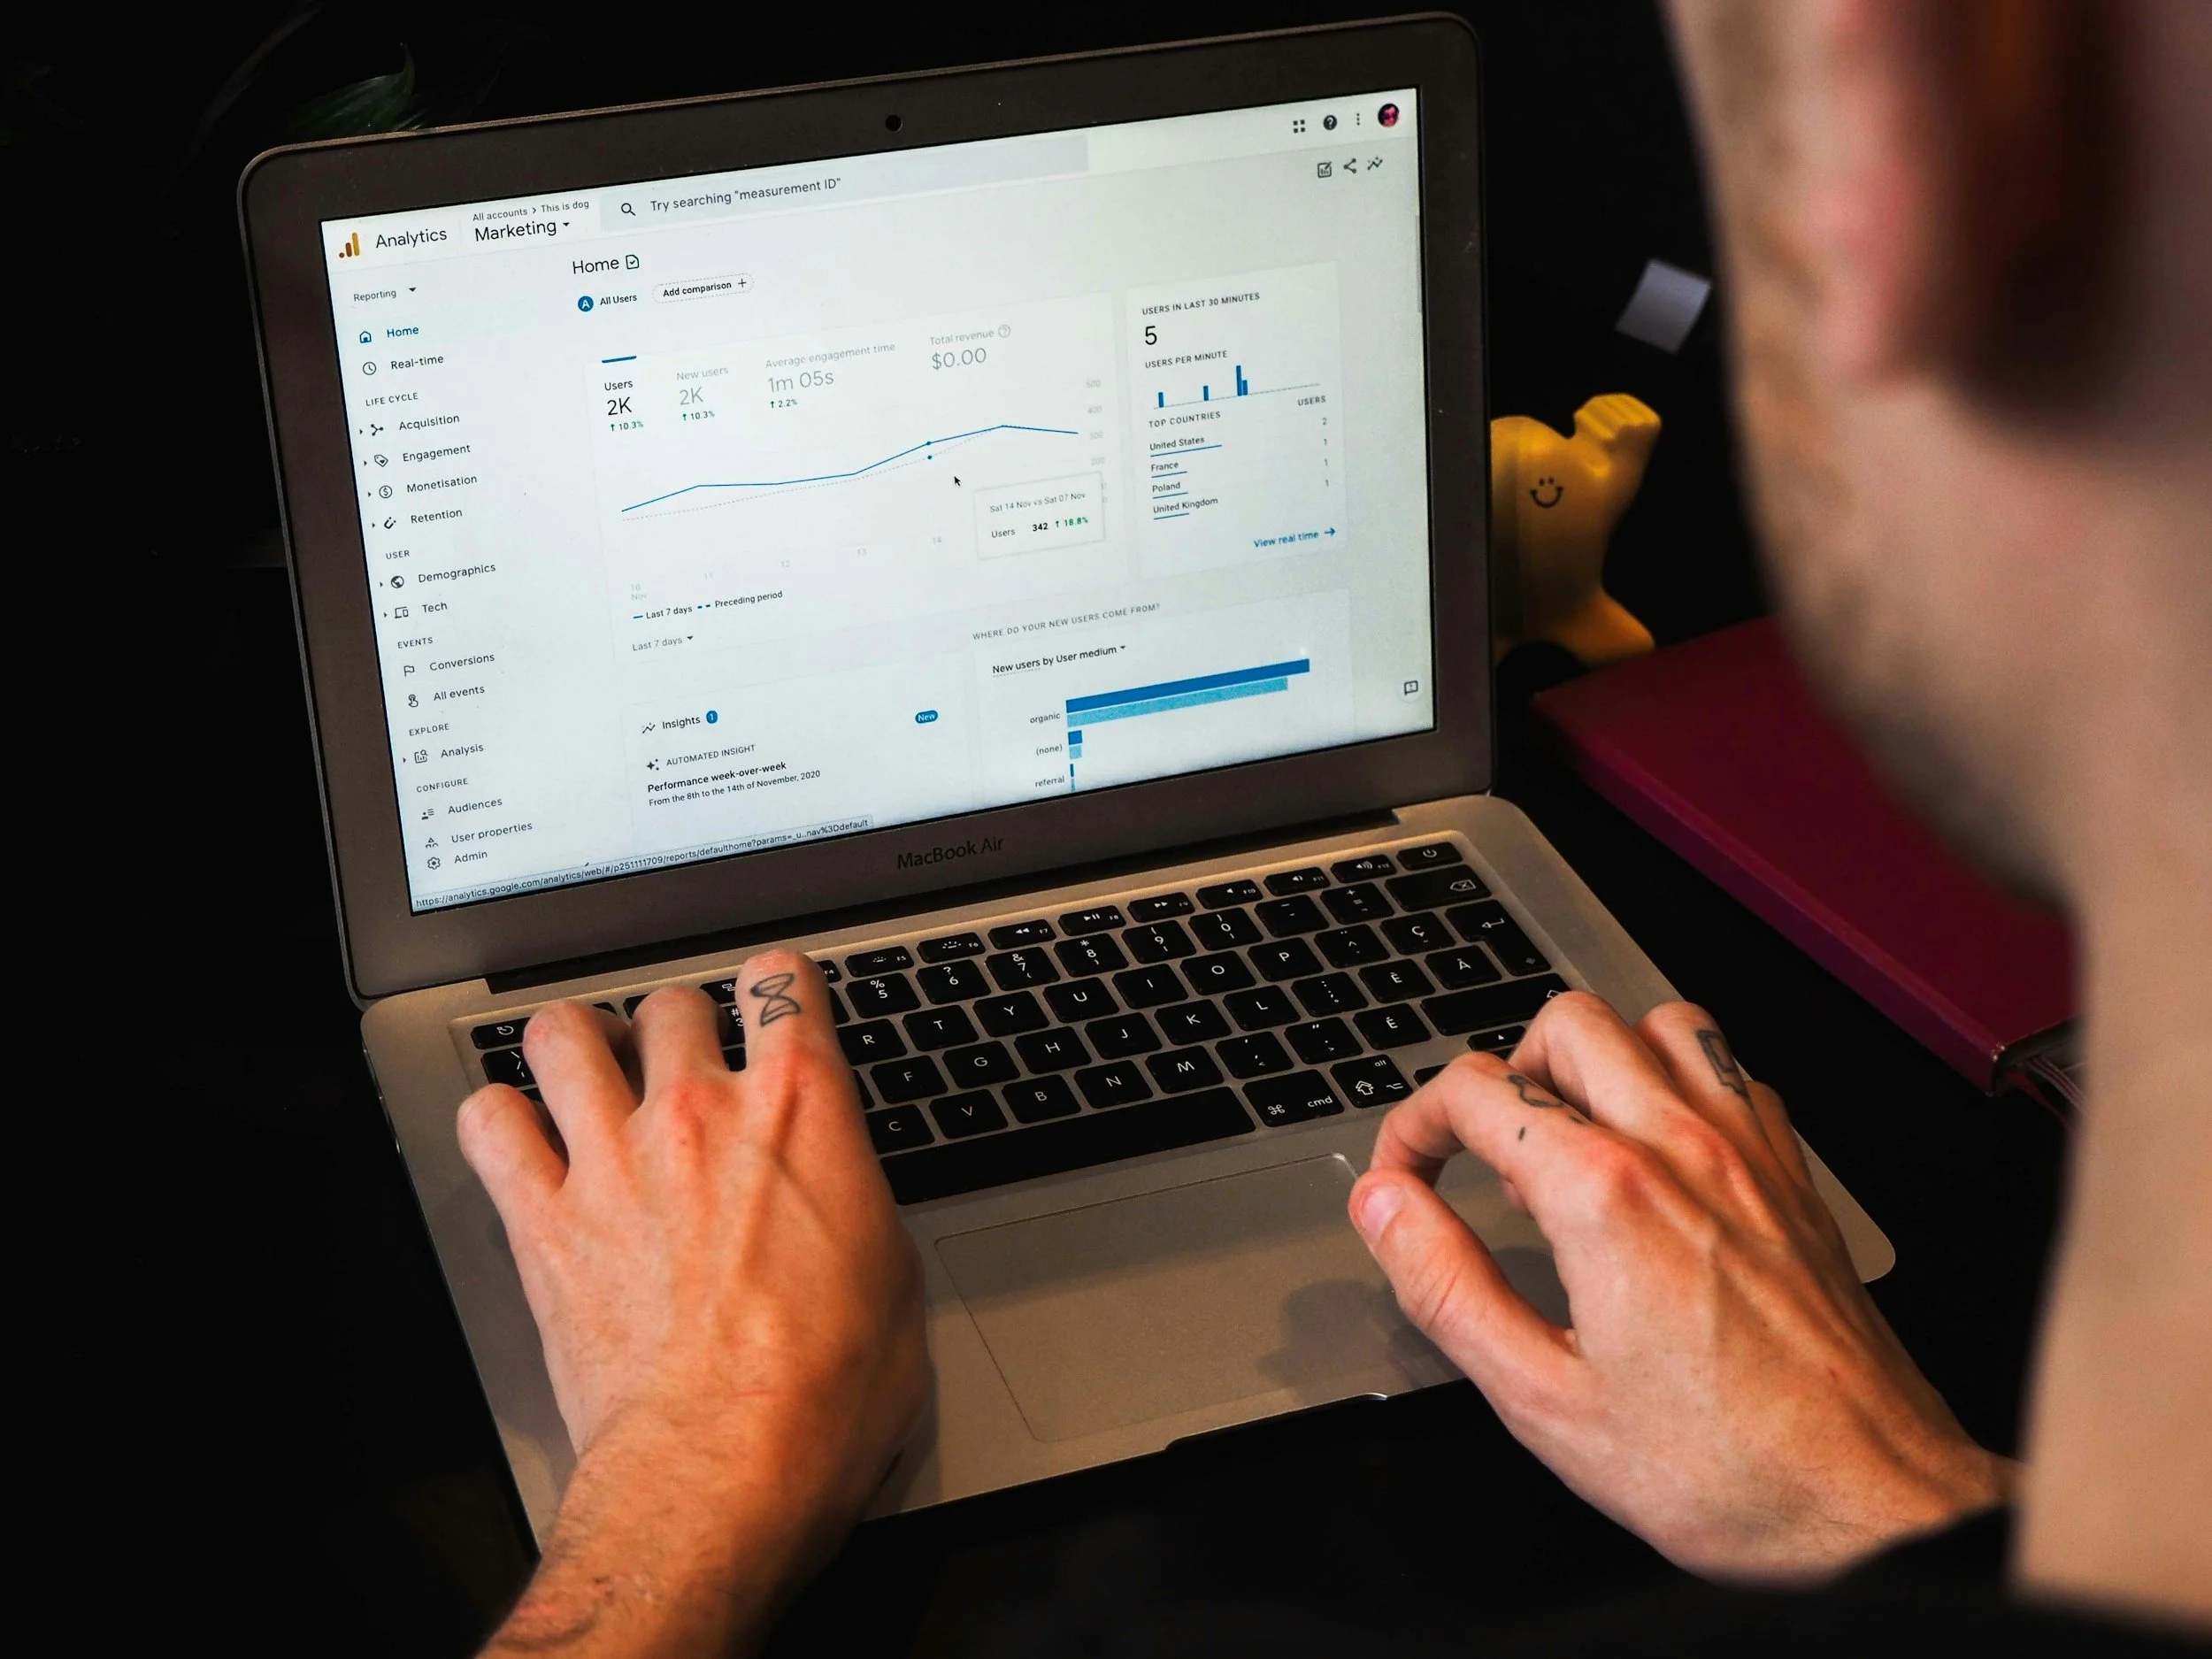
We use Google Analytics 4 (GA4) as our main measurement and analysis tool. It’s powerful and free.
We also use Google Tag Manager (GTM) to implement custom measurement, including pixels like Meta. It’s also free.
For reporting and visualisation, we like to use Google Looker Studio (formerly Data Studio). It’s more attractive and flexible than GA4’s native reporting interface and allows us to bring in additional data sources, such as your own in-house data (eg CRM data) or third-party data such as Meta. Looker is free, but sometimes we also use paid connectors like SuperMetrics, depending on your needs.
Audits & Enhancements
Even perfect setups need regular reboots. We’ll take a look under the hood to make sure everything is working as it should, and advise on next steps to take you to the next level.
Here’s our audit process:
Kickoff call: First we get to know you, your business, and your goals. We’ll also talk about what’s been done before so we don’t waste time or mess anything up.
Measurement plan: Based on your goals, we’ll map out what needs to be measured and how.
Discovery: We’ll dive into your existing setup and see what’s working well, what could be changed or added, and what needs to go.
Report-back: We’ll come back to you with a list of suggested improvements and you can decide what we do and what we don’t.
Implementation and testing: We’ll setup up a testing environment and make sure we have everything working perfectly before we go live.
Rollout: Once everything’s ready, we’ll deploy to live and test again.
Handover / ongoing support: Depending on your needs, we can either give you a full, well-documented handover, or continue to provide ongoing support such as monthly reporting highlights.
We also do smaller, tighter-scoped implementations, for example:
Problem-solving a specific issue with your tracking
Implementing new/improved tracking of a particular feature
Ready to get started?
Reports & Data Visualization
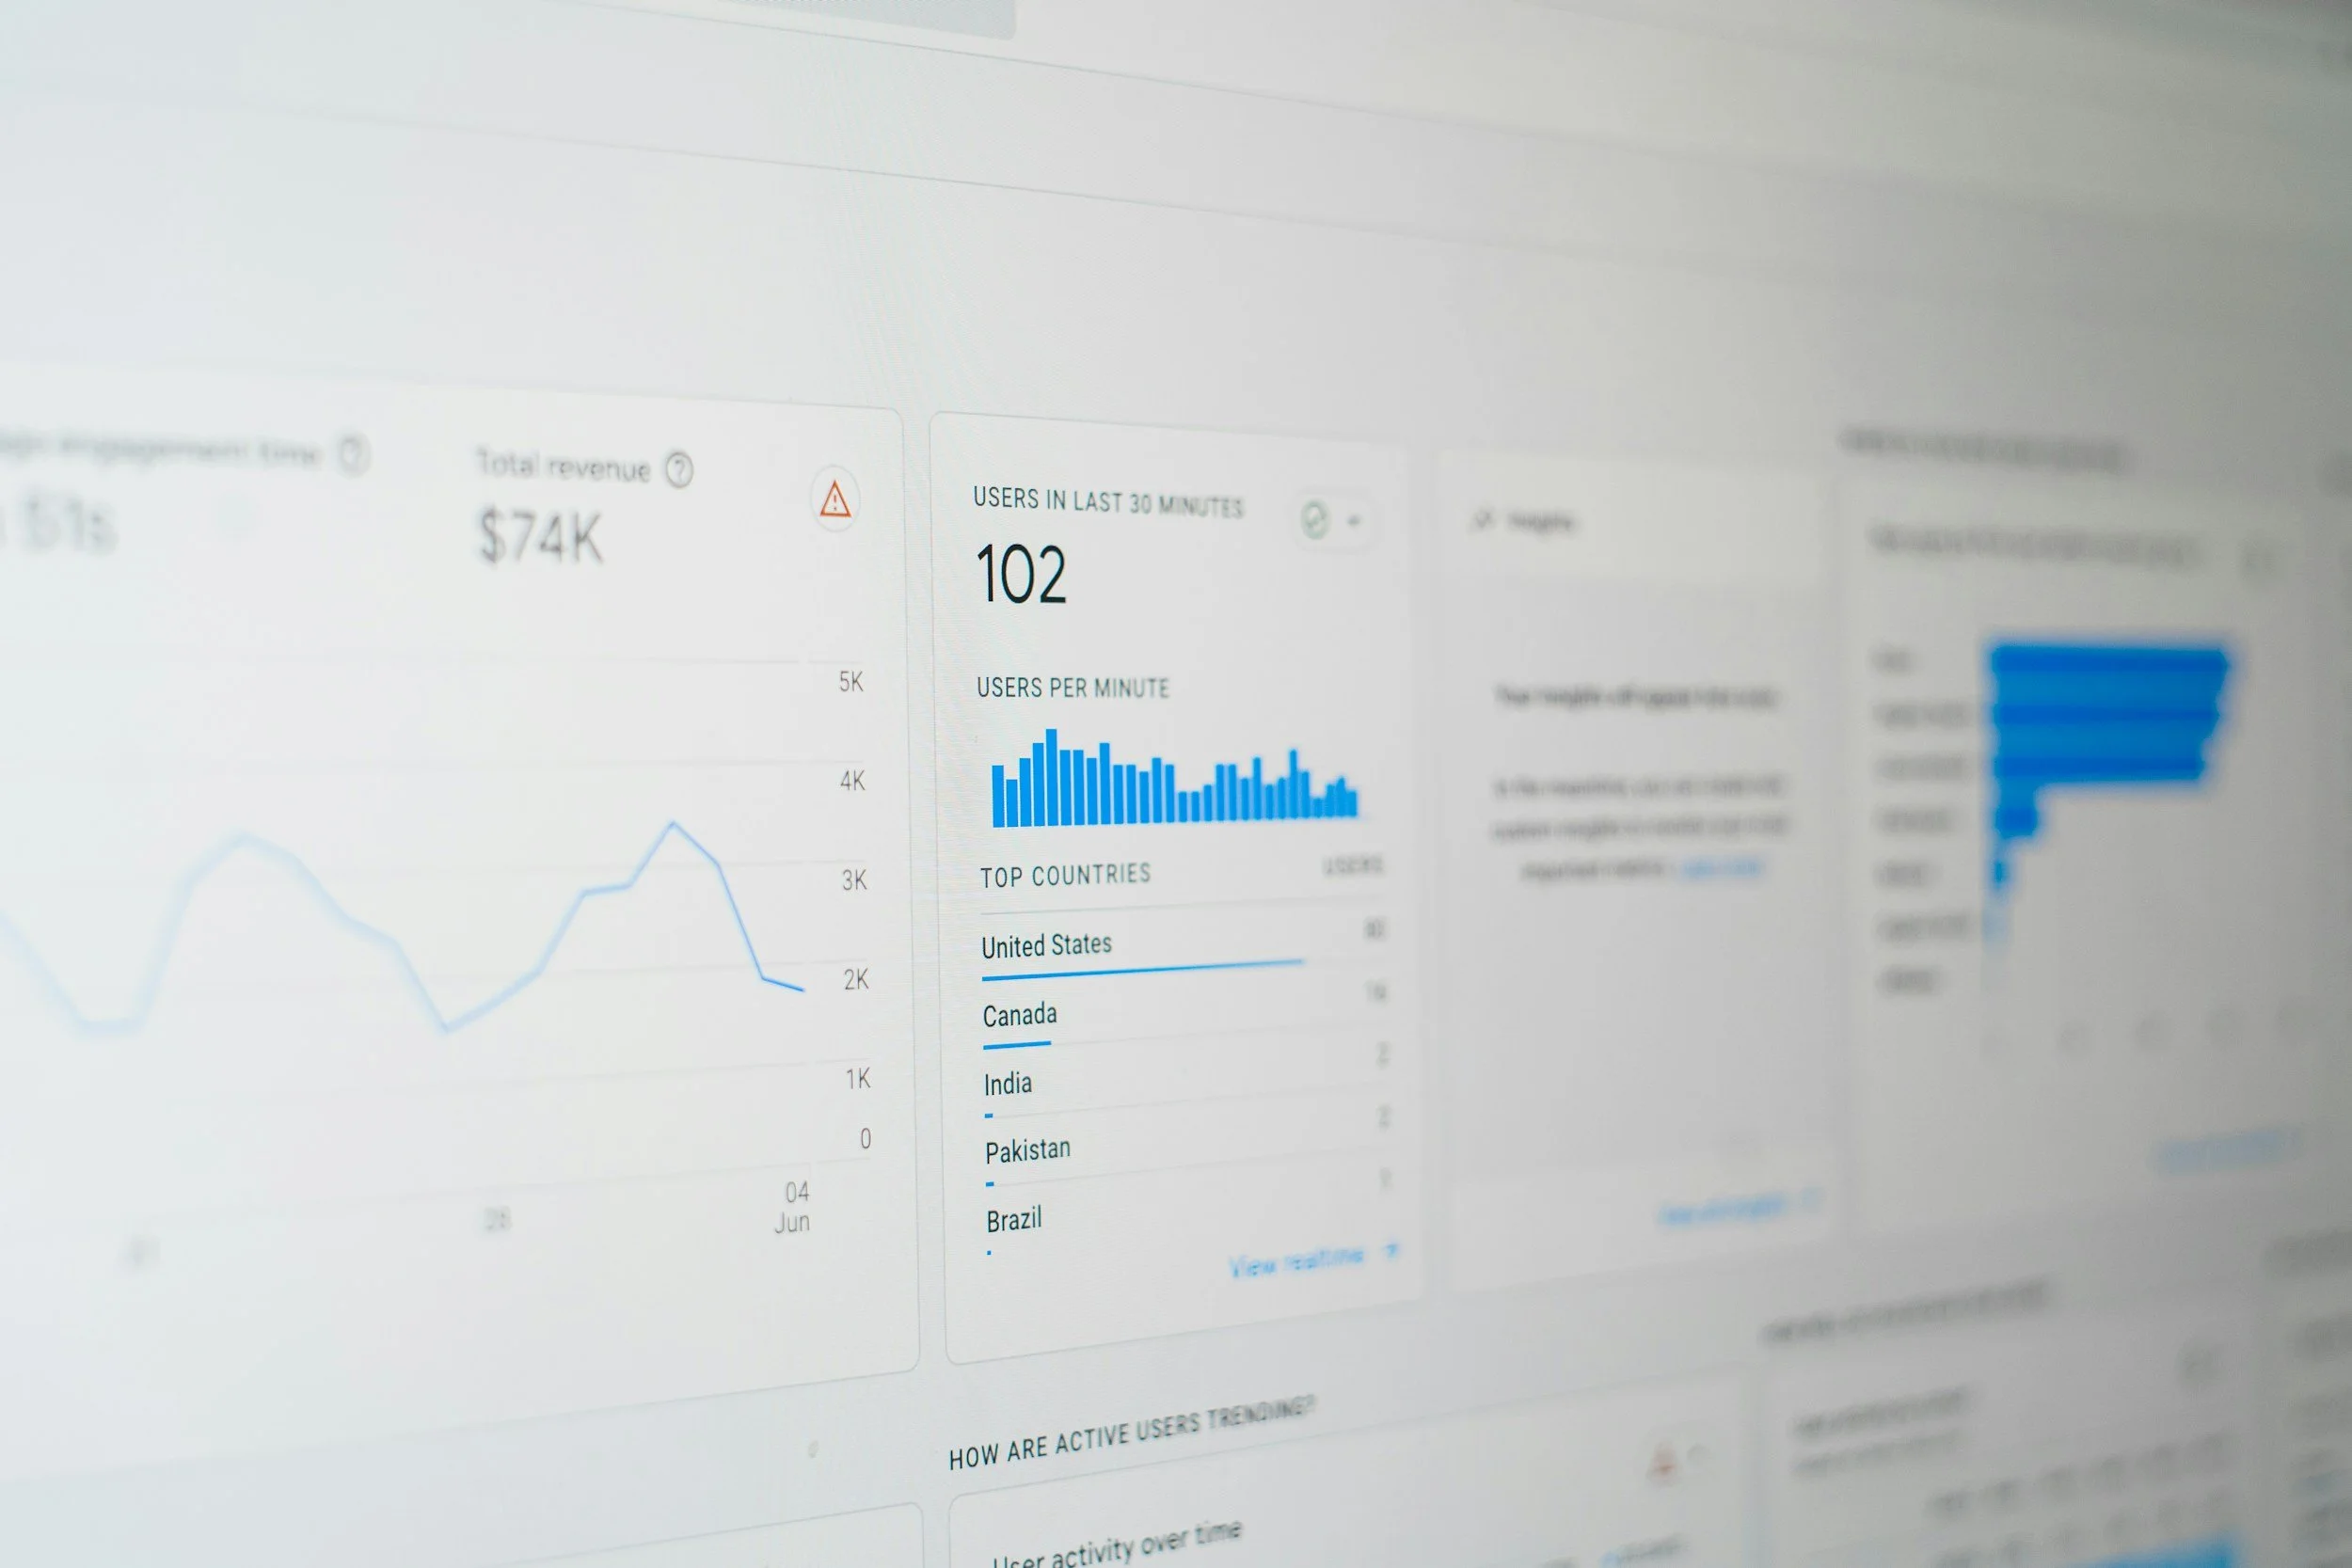
At Lucidate, we love data. But not everyone wants to scroll through tables all day. So we pride ourselves on building reports and dashboards that allow decision-makers to see the full picture and immediately grasp the implications.
We bring together multiple data sources so you don’t have to waste time flipping amongst multiple tools and wondering how everything relates. We strip back everything you don’t need to see, and highlight only what’s important. So you can make better decisions, faster.
We use Google Looker Studio because it’s free and it’s flexible. We’ll pipe in your various data sources, integrate them as necessary so you can see the whole 360, and deliver everything in an attractive — and interactive — package that will actually make you excited about viewing reports.
Ready to turn your data into action?